← Home
Tive Inc.
2023 - 2024
Senior Product Designer
Enterprise Analytics
Enterprise Analytics
Tive Inc • 2023 - 2024 • Senior Product Designer
Analytics for supply chains, from embedded charts to custom dashboards.
Analytics for supply chains, from embedded charts to custom dashboards.
At Tive, I led the design of a new analytics module for the platform. Customers used Tive’s real-time trackers to generate shipment data inside the product, but that data was primarily used for monitoring. Analytics existed only in a limited, external form for a small set of clients and were not part of the core experience. As Tive introduced tiered pricing, analytics became a key capability in the Enterprise offering.
At Tive, I led the design of a new analytics module for the platform. Customers used Tive’s real-time trackers to generate shipment data inside the product, but that data was primarily used for monitoring. Analytics existed only in a limited, external form for a small set of clients and were not part of the core experience. As Tive introduced tiered pricing, analytics became a key capability in the Enterprise offering.
There was pressure to surface small, contextual insights across the product. I aligned with the direction but challenged the sequencing: without a shared analytics foundation, isolated insights would be fragile and hard to scale. I pushed for starting with core analytics building blocks, establishing a centralized layer that could later support trends, insights, and eventually suggestive actions.
There was pressure to surface small, contextual insights across the product. I aligned with the direction but challenged the sequencing: without a shared analytics foundation, isolated insights would be fragile and hard to scale. I pushed for starting with core analytics building blocks, establishing a centralized layer that could later support trends, insights, and eventually suggestive actions.

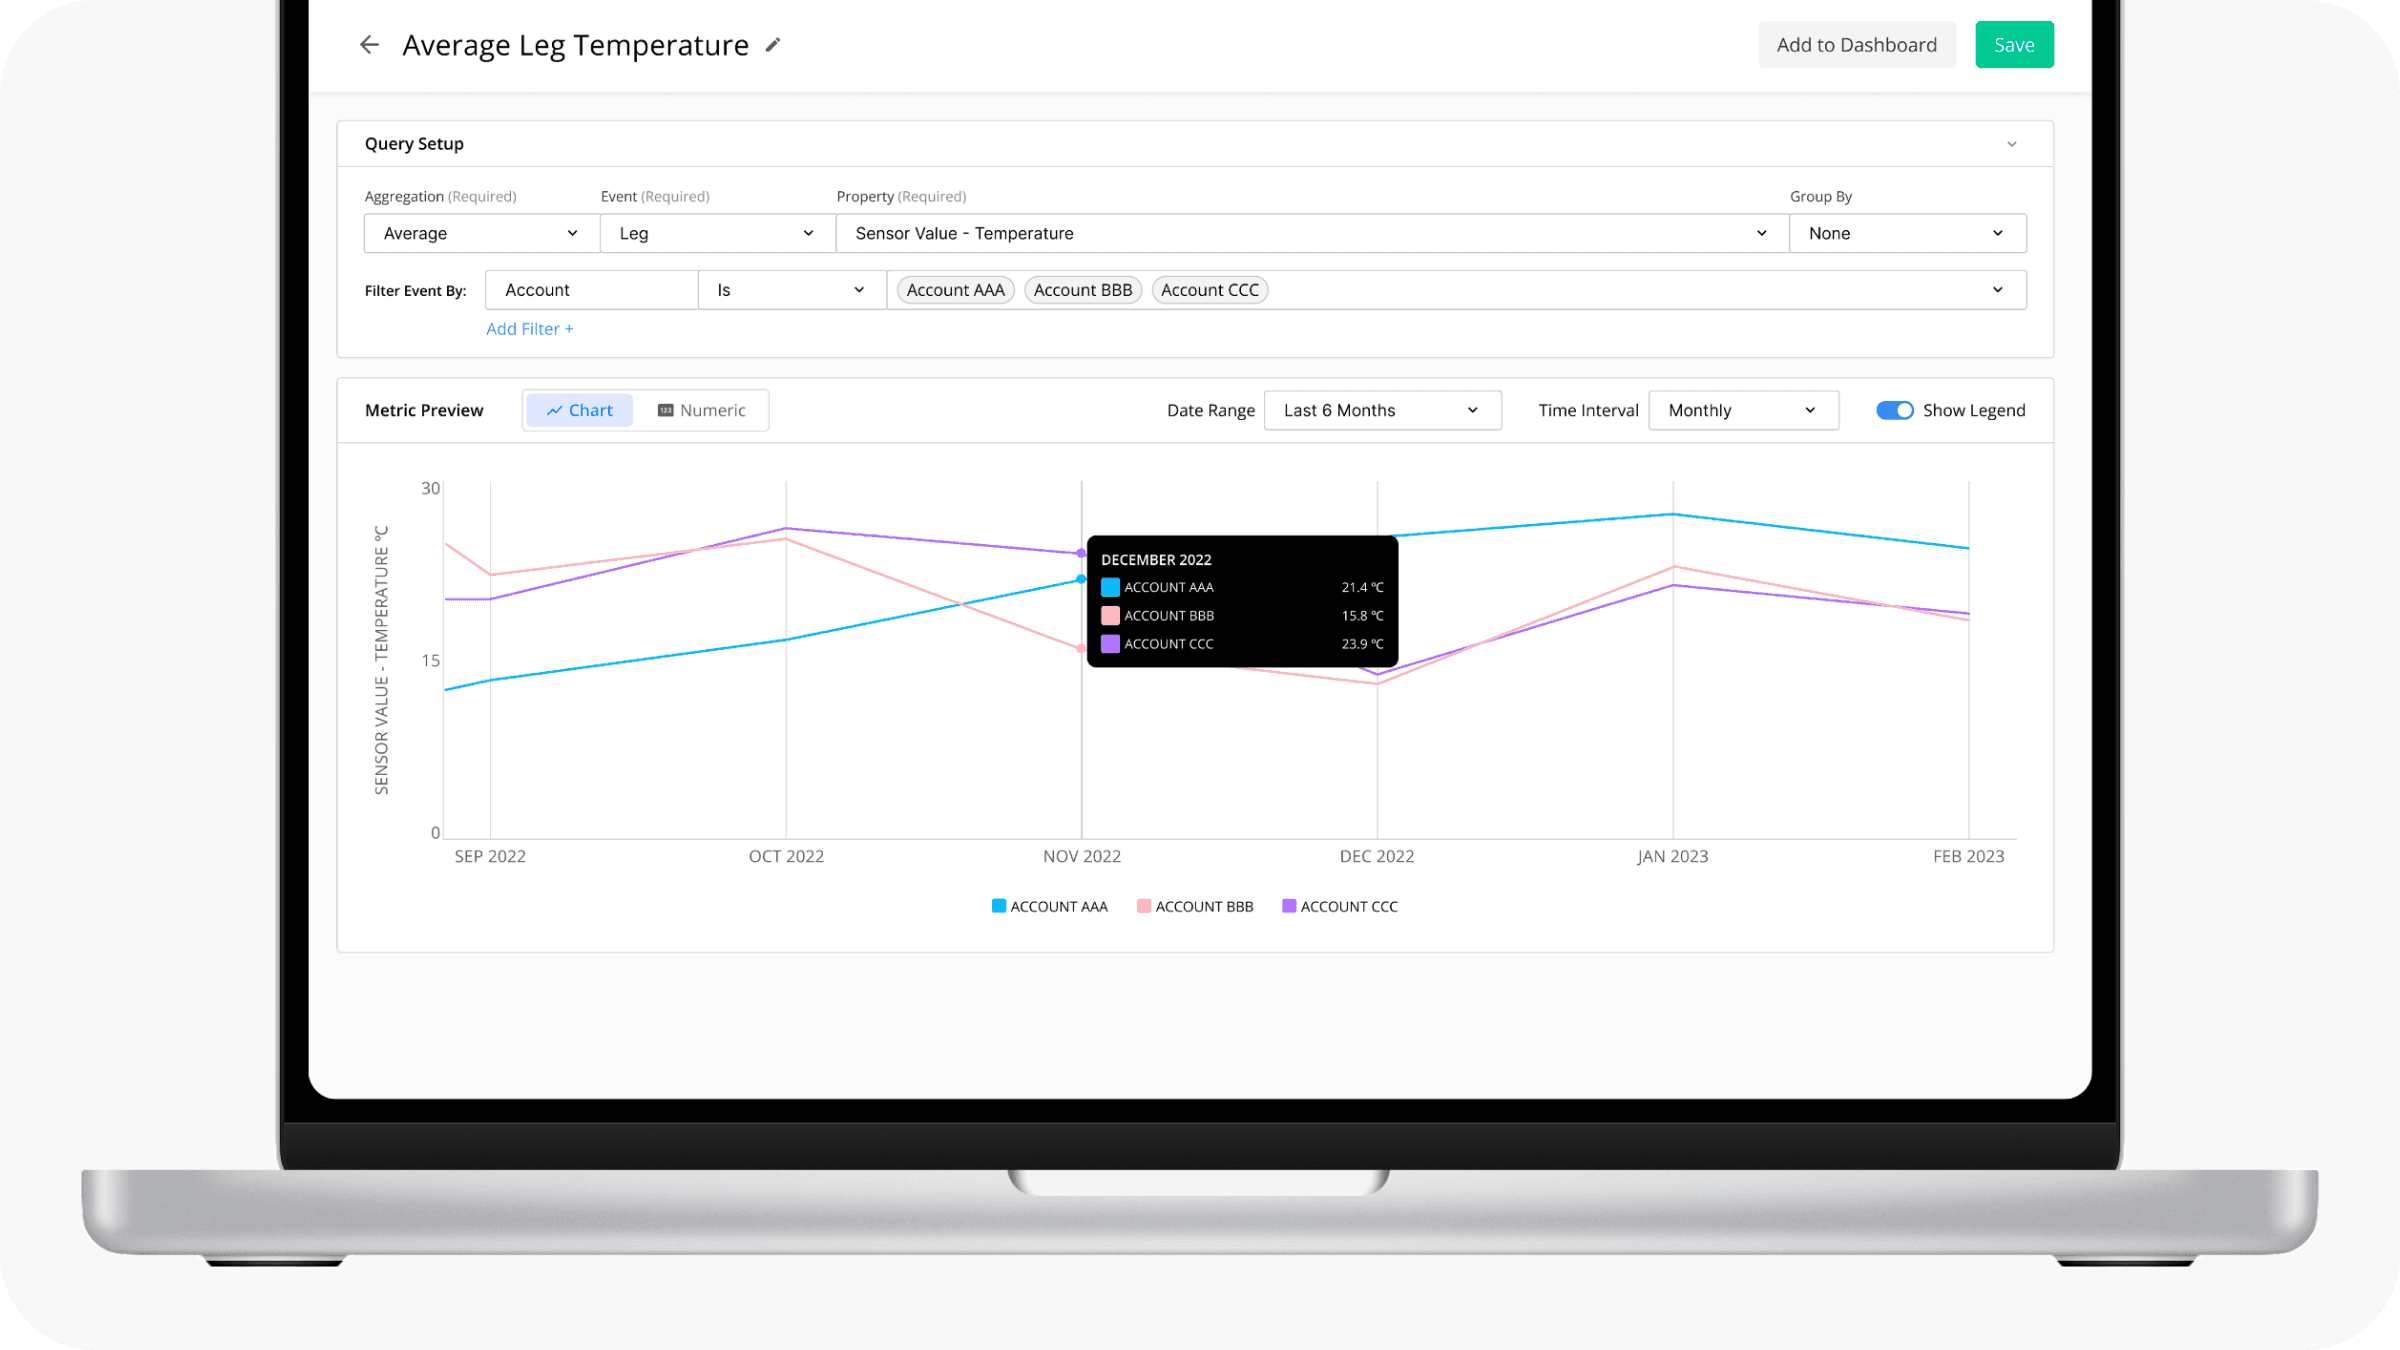
We first experimented by embedding analytics widgets from our data portal, but the approach limited UX and made it difficult to track how people actually used the feature. We then moved to building analytics natively inside the platform. We launched a general analytics view with historical charts and high-level metrics. Based on customer interviews, we introduced custom metrics: instead of fixed KPIs, users could define metrics across supply-chain perspectives: carrier, shipment, alert, route, and see results recompute live as inputs changed. These metrics could then be assembled into dashboards, allowing teams to group, filter, and share performance views across accounts.
We first experimented by embedding analytics widgets from our data portal, but the approach limited UX and made it difficult to track how people actually used the feature. We then moved to building analytics natively inside the platform. We launched a general analytics view with historical charts and high-level metrics. Based on customer interviews, we introduced custom metrics: instead of fixed KPIs, users could define metrics across supply-chain perspectives: carrier, shipment, alert, route, and see results recompute live as inputs changed. These metrics could then be assembled into dashboards, allowing teams to group, filter, and share performance views across accounts.

Supporting this required platform-level optimization. Engineers were concerned about load performance and backend recomputation as users expanded date ranges, accounts, and filters. I worked closely with engineering to adapt the UX to these constraints, removing unnecessary steps while preserving interactivity. The result was an interface that allows users to explore data fluidly and build metrics and dashboards around what mattered to their operations.
Supporting this required platform-level optimization. Engineers were concerned about load performance and backend recomputation as users expanded date ranges, accounts, and filters. I worked closely with engineering to adapt the UX to these constraints, removing unnecessary steps while preserving interactivity. The result was an interface that allows users to explore data fluidly and build metrics and dashboards around what mattered to their operations.
Enterprise Analytics
Tive Inc • 2023 - 2024 • Senior Product Designer